1) No other time in our history have we been exposed to this much information. The best way to make sense of it all is through statistics. Any Geospatial Analyst worth his salt will not only have a greater understanding of statistics, but can use this knowledge to predict future events. Through standard algorithms and probability equations (linear regression, Bayes’ Theorem, Chi-squared), GIS professionals should be able to anticipate incidents and recognize trends. Traditional statistics are often dismissed as an antiquated and difficult to understand method. The truth is people are afraid of what they don’t understand. Statistics in its many forms are a relatively easy way to understand and model data.
2) Without intimate knowledge of regional cultures, ideologies and traditions, a comprehensive answer can never be discovered. Data in its many forms can only paint a partial picture. Spend time to discover the truth that rests in the individuals responsible for establishing this information. Human geography reveals many secrets that typically are hidden in the data. Why did the 2014 West African Ebola outbreak impact so many people? A greater understanding of the region would uncover that culture played a major role in the spread of the disease. Epidemiology models behavior and not the corruption and distrust of local governments.
3) Expand your knowledge of non-traditional data formats and GIS software programs. ArcGIS is a powerful comprehensive package that is capable of performing virtually any GIS function that exists. It is however extremely expensive and not very intuitive. It also uses an archaic file format (shapefile) that requires at least three separate files to form one geospatial entity. Learn some of the more contemporary file formats that are easily exchangeable between platforms and programs. GIS file formats such as GeoJSON and GML are becoming more and more popular and are based upon open standards accessible by all. Additionally if you really want to distance yourself from the crowd, spend some time learning about other software solutions that will scale to fit your needs. Some examples include: CartoDB, MapBox or QGIS.
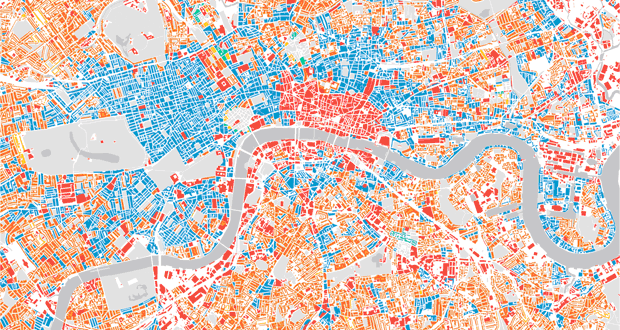
4) Learn how to visualize your comprehensive analysis in an appealing unambiguous way. Many GIS software programs do not have the capability to present analytical results that influence the audience. I’ve seen too many maps that are just plain ugly. Learn that through the use of subtlety, your message will be received and results will follow. Harsh coloring without the knowledge of simple tint dynamics will turn most people off. Recognize that deep dark coloring is very unappealing and shows ignorance of visualization standards. Research best visualization practices (i.e. infographics) to discover how best to convey your results. Learn how to use graphics programs like Adobe Illustrator to take your analysis to the next and final step.
5) Get back to the fundamentals and recognize that geography is the core. This field of science has many different sub disciplines that help shape an understanding of the subject you’re analyzing. Learn what they are and apply them. Geospatial analysis is all about relationships. Use the principles of Tobler’s Law to guide you through your results. Any good geospatial analyst will recognize that a holistic approach is the best way to find the answer you’re searching for.


